

Oil and gas currently are and will be the key energy resource of mankind for more than another hundred years. Russia has been and will remain, in this perspective, a country possessing the richest reserves of these energy resources. Therefore, the development of oil and gas fields is one of the top-priority sectors of the Russian economy, that largely determines the growth of the latter and also is an important source of budget replenishment, ensuring the successful implementation of social, defense and other government programs.
In our country, growth in the production of oil and gas energy resources has always been a relevant issue, but it was dampened by natural processes of depletion (aging) of oil and gas fields and the need for development of new regions. This trend can be clearly traced in the history of oil production in Russia, which goes back to the development of the North Caucasus region in the first decades (the 1920s-1930s) of the last century. Later, in the 1940s-1950s, fields in the Volga-Ural and Timan-Pechora oil and gas provinces were massively developed, and in the 1960s-1970s, the development efforts encompassed fields in Western Siberia and Sakhalin Island. Presently, oil and gas production is commenced in Eastern Siberia, in the Far East and in the shelf area of the Arctic seas. It should be noted that the development of new fields which are often located in underpopulated and/or hardly accessible places required the re-creation of production and residential infrastructure, transportation systems, teams of professionals, etc. The massive development of deposits in old and new regions in the 1950s-1980s led to explosive growth in oil production in the USSR, when oil production volume increased from 18 to 547 million tons per year, i.e. more than 30 times. During the period of "perestroika" (economy reformation), the collapse of the USSR, privatisation, etc. oil production in Russia decreased sharply. Over the past 20 years, mainly due to enhanced oil recovery in the developed fields, the production volume began to grow and increased 1.8 times as compared to the minimum level observed in the late 1990s. However, over the past 7 years, the production growth was as low as ~5%. In this connection, a conclusion can be made that mineral resources in old oil-producing regions of Russia have been already exhausted. Nevertheless, we believe that not mineral resources have been exhausted, but the technologies used for their development. This is clearly confirmed by the current state of oil production in the USA.
It is known that by the 2010s, oil production volume has decreased (since 1971) by almost half. But due to the implementation of “shale” technology, the USA has managed to almost double the oil and gas production over the past 10 years, that allowed the country to fully satisfy own need for these energy resources and even start exporting them. Currently, the USA produces 66% of oil from "shale" deposits. Thanks to the use of "shale" technologies, this country has become one of the leading oil and gas producer (along with Saudi Arabia and Russia). The example of the United States demonstrated that even after an almost 40-year decline, a country can be able not only to restore its oil production, but also to become the world industry leader. A prime example of this process is the state of Texas, the oldest oil-producing region (the "cradle" of industrial oil production), where the oil production volume has been more than doubled over three years. Due to this, in 2017 alone, more than 27 thousand jobs were additionally created in Texas. Such countries as China and Canada can also be mentioned, which in 2016 comprised the top five countries that are leaders in oil production due to the common and active use of technologies for “shale” deposits development.
Therefore, along with the development of regions of the Eastern Siberia and the Far East, the development of shale deposits can be considered a reasonable way to increase oil production in Russia in the near future. In this case, the areas of the most effective shale oil production should be determined and shale technologies should be optimised, since their massive (worldwide) use has produced a number of negative economic and environmental effects. In this connection, let us first consider the features of shale deposits and production technologies.
Shale deposits consist of a mass of sedimentary rocks such as clay shales that occur over large areas (up to hundreds of thousands of sq. km with a maximum area of 1.2 million sq. km in West Siberia (bazhenites) and at various depths. For an interval in geological history, several million years long, organic matter, the highest concentration of which is observed in clays, was transformed into kerogen, oil and gas in the result of thermodynamic processes. Due to the very low pore permeability in clayey shales, the main amount of oil remains in the place of formation, and only a small part of it migrates in the lateral and vertical directions along main open megafractures in areas with intense open fracturing of geological terrain [3]. This movement is caused by quasiperiodic changes in the volume of open fractures ("increase-decrease"). (The “geodynamic pump” effect mainly derives from the process of daily compression and decompression of the geological environment under the effect of luni-solar solid tides [9].) Oil going along these channels from shale strata and penetrating others, as a rule, overlying rock beds with a relatively high porosity, migrates through these porous-permeable beds serving as a filter. If there is an overlying screen, oil accumulates here in various traps, from which it is extracted with the use of traditional technologies. However, main shale oil reserves remain in the oil-source formation and are practically inaccessible for production using traditional technologies.
Shale production technologies are based on the creation of artificial fracturing in oil-saturated rocks, that promotes oil inflow from shale stratum into the well. To ensure the inflow profitability, massive open fracturing is created, for which wells are drilled according to a dense uniform pattern with horizontal shafts of a length reaching 3 km and more. In the shafts, a number (up to one hundred) of hydraulic fracturing sets (multistage hydraulic fracturing) are performed at a distance, for example, of every 30 m (100 ft) in the shaft of a given length. However, according to statistics from US and Canadian fields, 30-45% of hydraulic fracturing ports provide less than 1% of total oil production, and 30% of ports provide more than 90% of production volume. At the same time, the average oil flow rate of production wells is reduced to 70% (from the initial rate) in 1.5-2 years of operation, that requires continuous drilling of additional wells to maintain the overall pace of production. Therefore, the implementation of such a technology for the development of shale deposits is connected with an increase in capital expenses associated with wells drilling and their preparation for operation. Even if all related activities (seismic survey, well logging, etc.) are excluded, the cost of shale oil production will be significantly higher than the cost of production based on traditional technologies, and sale of such oil is often unprofitable at low world prices.
Moreover, the use of this technology creates new environmental problems in production regions, such as: 1 - contamination of ground water (including potable water) due to the natural development of artificially created open fracturing in the upward direction (up to the surface), and 2 - increase in seismic activity with a growth of the number of earthquakes (with a magnitude of 3-5 points) by a hundred times (as was in the state of Oklahoma, the USA [2]) due to the redistribution and relaxation of the geological environment stress state during massive formation of artificial fracturing and injection of large amounts of propping agent into the rock bed. It is for these environmental reasons that in some states of the USA and in a number of European countries (for example, in the Netherlands), multistage hydraulic fracturing was prohibited.
Considering the above-mentioned features of shale deposits and technologies which are widely used for their development, the following conclusions can be made.
Firstly, shale deposits including oil-source formations contain reserves in the amount that is several times higher than the amount of oil and gas in traditional structural traps in deposits located in the same region or production field. Therefore, shale deposits should be developed on a first-priority basis in the old oil and gas production regions of the North Caucasus, the Ural-Volga region, Western Siberia, Timan-Pechora and other Russian regions with preserved infrastructure, transportation systems, professional specialists, scientific and educational organisations, and, which is very important, extensive and detailed information on the oil content in the geological environment, the reliability of which is largely verified by drilling.
Secondly, the above-mentioned non-uniformity of oil inflow into multistage fracturing ports and even its absence (in 30-45% of the ports) while observing the common technical and technological standard procedure of hydraulic fracturing in all ports (in case of multistage fracturing) in a well is indicative of the existence of “chancy” areas in the productive shale stratum, where abnormally high and maximum possible oil inflows can be obtained. These areas are characterised not only by high level of oil saturation, but also and most importantly by well-developed natural open fracturing, since the technogenic fracturing created using the hydraulic fracturing method inherits natural fracturing pattern and makes it more intense [4]. In areas with compressed subsurface, technogenic fracturing usually collapses. In this case, propping agent is either broken down or pressed into the rock for several hours or days, that results in further compaction of the reservoir [11], which leads to the absence of oil inflow in this place after hydraulic fracturing. Therefore, information on the lateral fracturing distribution and oil content in the shale mass can help significantly increase the efficiency of oil production due to the selection of the optimal well drilling locations, directions, routes and lengths of horizontal wells, as well as “chancy” (most fractured and oil-saturated) intervals in these wells, best suitable for hydraulic fracturing.
Thirdly, while the development of shale deposits is a real impetus for recovery of old oil and gas production regions, direct adoption of shale technologies developed in the USA cannot be considered reasonable due to the above-mentioned negative economic reasons and environmental consequences. The existing technological scheme for the development of shale deposits should be supplemented by technologies which can provide information about the uneven distribution, firstly, of open fracturing in the geological environment and, secondly, of oil saturation in the shale mass. Using this information will allow for the reduction of the total number of production wells, the size of their horizontal shafts, and the number of hydraulic fractures, which, respectively, will ensure a multiple reduction of capital expenses associated with the shale deposits development. Furthermore, the significant reduction in the scope of multistage fracturing will also significantly reduce or eliminate negative environmental consequences. Therefore, the key issue for the implementation of highly profitable and environmentally safe production of shale oil is the use at the initial stage (before drilling engineering) of technologies for study of fracturing and oil content in the geological environment in order to ensure, based on the information obtained, that wells with horizontal shafts are drilled in optimal locations and directions and hydraulic fracturing is performed with optimal intervals to obtain the maximum possible oil inflow.
The main source of that important geological information is seismic survey, which, like a “tomograph” for the geological environment, allows for studying not only the layered structure, which is commonly performed, but also the distribution of fracturing and oil content in the volume of the geological environment under survey. The most reliable and detailed information on open fracturing and oil content can be obtained from the use of unconventional seismic waves called diffuse reflection (DR) and microseismic emission (MSE), respectively. The reliability of the obtained information on fracturing and oil content is ensured by the dominant dependence of the genesis of DR and MSE waves on the said environment characteristics. (For example, a similar dominant influence of genesis on the reliability of seismic information exists for specular reflection (SR) waves which are formed at the bed boundaries, that creates a possibility to obtain the most reliable information on the sedimentary structure. The reliability of such information is confirmed by the fact that data on traps with possible accumulation of oil and gas, obtained with the use of SR waves have been used for almost a hundred years for the selection of well drilling locations.)
Seismic DR waves are dominantly formed on the complex of open fractures in the 1st Fresnel zone, and their amplitude determines the intensity of open fracturing of the geological environment in this area [7]. 3D open fracturing index field can be obtained by separation of DR waves in the observed seismic wave field and their positioning in a given volume of the geological environment, and 4D field can be obtained by monitoring.
Seismic MSE waves permanently exist throughout the geological environment and arise during the growth and collapsing of open fractures [11]. Since the fluid (water, oil and gas) that fills up a fracture space has various viscosity, the random process of viscoelastic radiation (emission) of MSE waves in the observation time interval is characterised by different amplitude and time parameters (average level, dispersion, and autocorrelation) for oil- and gas-saturated rocks [1, 5, 6]. The monitoring of MSE waves, their identification for each observation point in the geological environment, and determination of the amplitude and time parameters of the random MSE process at these points provide 3D information on the heterogeneity and non-uniformity of fluid saturation of the geological environment within the given volume.
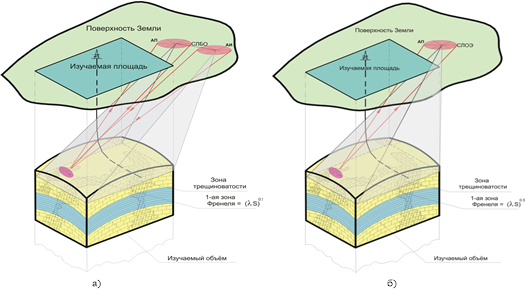
For the implementation of the said features for determining the fracture density and fluid saturation of the geological environment, scientists and experts of the Professor O.L. Kuznetsov's Scientific School for Oil and Gas Seismoacoustics developed and practically implemented fundamentally new (innovative) seismic technologies called Side-Scan Seismic Radar (SCSR) and Seismic Location of Emission Centers (SLEC) [6, 7]. In Fig. 1, basic linear schemes of focused location scanning in active (a - SCSR) and passive (b - SLEC) observation modes are shown. Using the principle of focusing scanning, DR waves (SCSR) and MSE waves (SLEC) can be distinguished in the observed seismic wave field and positioned in the geological environment to obtain 3D distribution, respectively, of open fracturing and fluid saturation in the given volume of the geological environment under survey.
|
Earth surface |
Поверхность Земли |
|
Studied area |
Изучаемая площадь |
|
Receiving aperture |
АП |
|
SCSR |
СЛБО |
|
Transmitting aperture |
АИ |
|
Fracturing zone |
Зона трещиноватости |
|
1st Fresnel zone = (λS)0.5 |
1-ая зона Френеля = (λS)0.5 |
|
а) |
а) |
|
Receiving aperture |
АП |
|
SLEC |
СЛОЭ |
|
b) |
б) |
Fig. 1 Basic linear schemes of focused location scanning for SCSR in active observation mode (a) and SLEC in passive observation mode (b).
SCSR (since 1991) and SLEC (since 2005) technologies have been used to solve various problems in oil and gas fields both in Russia and foreign countries such as Belarus, USA, Iran, Egypt, Vietnam, etc. [1]. In 2008, these technologies were awarded the Russian Government Prize in the field of science and technology [10], which confirms the recognition (actual and official) of their high efficiency.
The SCSR and SLEC technologies can be applied both by independent location observations (Fig. 1) and by processing the source materials of traditional 3D seismic survey on using the Common Depth Point (CDP) method. In this case, complex seismic survey (CDP + SCSR + SLEC) can provide consolidated 3D information on the structure, fracturing and fluid content of the geological environment, that ensures a qualitatively new level of development of hydrocarbon resources at brownfields.
This makes it possible not only to identify all oil-containing objects (deposits) located in various traps, including low-amplitude and non-structural (tectonically and lithologically screened) ones, in the studied volume of the geological environment and in the oil source shale mass, but also to ensure their effective development and to reduce the cost of oil production. For this purpose, the above-mentioned seismic information is used to drill wells in areas with abnormally high oil content and open fracturing to obtain abnormally high and maximum possible oil inflows. Such an approach to well placement is fundamentally different from traditional uniform drilling schemes and helps significant reduce the drilling volume by avoiding drilling wells with missing or unprofitable oil flow. (Suffice it to note that presently, for example, at fields with a carbonate reservoir, 10-15% of production wells provide 85-90% of the total oil production. These figures are indicative not only of the inefficiency of relatively uniform location of production wells, but also of the possibility to significantly reduce their number by optimal placement in “good” points). The reduction in drilling volume helps minimise capital expenses and the time required for bringing into development new deposits discovered at brownfields. In addition, due to the high oil inflows in the first drilled wells, new deposits become attractive for investment in their development.
Another area of application of the SCSR and SLEC technologies, which is not less important, is seismic monitoring of developed deposits, i.e., the implementation of a new direction of seismic survey called "oilfield seismometry". In this area, in contrast to the conventional CDPM-4D technology, seismic monitoring can be performed on a continuous basis for an unlimited period of time with possible provision of results in the online mode, for example, when monitoring drilling processes, technogenic impacts, etc. To implement such monitoring, receiving seismic antennas are mounted at the field, and continuous monitoring and processing the natural (in case of use of SCSR technology) and artificially excited (in case of SLEC) seismic wave field are performed.
The main deliverable obtained from such monitoring is 4D information on the spatial and temporal changes in the intensity of open fracturing and rock destruction (for example, in the course of drilling) in the geological environment and the fluid content (oil, gas and water) in the productive strata under survey. This information allows for solving a wide range of applied problems to optimise the development process. It is worth mentioning that many of them had not been even raised in seismic survey due to the impossibility of their solution by using conventional technologies. These are, for example:
-
determining the configuration of the front of oil displacement by water in the inter-well space, identifying the "pillars" in the watered part of the deposit and areas with high oil content beyond the deposit boundaries;
-
identifying first-priority wells for well intervention, including hydraulic fracturing, in order to multiply increase the oil flow rate;
-
controlling the effectiveness of technogenic impacts on the productive formation (hydraulic fracturing, water and gas injection, seismic acoustic impact, etc.);
-
determining the optimal conditions of water injection into intake wells;
-
forecasting emergency situations and optimising well drilling parameters, etc.
The solution of these and other geological, commercial, technological and environmental problems by seismic monitoring methods with the use of SCSR and SLEC technologies allows for increasing the withdrawal rate (average flow rate) and oil recovery (ORR) while reducing the cost of oil production and ensuring the environmental safety.
Below are some examples of solving a number of applied problems to improve the efficiency of exploration and development of oil and gas deposits based on the use of innovative SCSR and SLEC technologies.
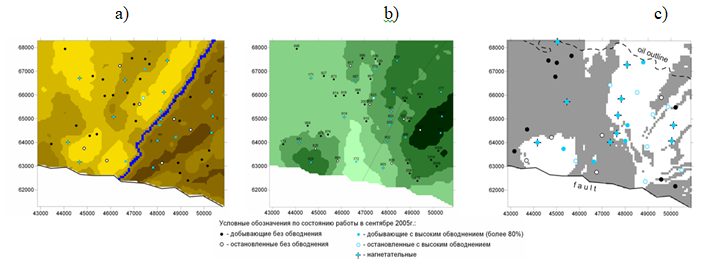
Example 1. In Fig. 2 and Fig. 2a, the results of the primary and interpretive processing of SLEC monitoring data are shown, which was carried out on a continuous basis for 21 days at the Rostoshinskoye field in the Orenburg region [8]. The object of the survey was productive horizons D3 and D4 located at a depth of about 4 km. The total area of the location survey with the use of the SLEC technology was 56 sq. km. The results of the conducted survey were obtained for the current period of the field development, which was almost 20 years at that time.
The lithofacial characteristic (a) and strata pressure non-uniformity (b) were determined based on the average values and dispersion of the MSE process at each point of horizon D3, and the heterogeneity of the fluid content (c) was determined with the use of additional information about the water encroachment into the production wells located along horizon D4. In the latter case, a front of oil displacement by water pumped with injection wells of the meridional row in the northern part of the area was clearly observed in the northern half of the area (Fig. 2-c). The presence of oil-saturated areas in the watered part (in the north-east of the site) and beyond the deposit boundaries (in the north-west) is also observed. It should be noted that the high oil saturation in both selected areas was further confirmed by subsequent drilling.
|
68,000 |
68000 |
|
Designation of operation state as of September 2005: |
Условные обозначения по состоянию работы в сентябре 2005г.: |
|
67,000 |
67000 |
|
- production well without water encroachment |
- добывающие без обводнения |
|
66,000 |
66000 |
|
- production well with high water encroachment (more than 80%) |
- добывающие с высоким обводнением (более 80%) |
|
65,000 |
65000 |
|
- inactive wells without water encroachment |
- остановленные без обводнения |
|
64,000 |
64000 |
|
- inactive wells with high water encroachment |
- остановленные с высоким обводнением |
|
63,000 |
63000 |
|
- intake wells |
- нагнетательные |
|
62,000 |
62000 |
|
|
|
|
43,000 |
43000 |
|
|
|
|
44,000 |
44000 |
|
|
|
|
45,000 |
45000 |
|
|
|
|
46,000 |
46000 |
|
|
|
|
47,000 |
47000 |
|
|
|
|
48,000 |
48000 |
|
|
|
|
49,000 |
49000 |
|
|
|
|
50,000 |
50000 |
|
|
|
Fig. 2. Results of MSE wave processing based on the results of SLEC monitoring at the Rostoshinskoye field in the Orenburg region: a) change in the terrigenous composition of clays (yellow) and sandstones (brown) in the productive strata D3, b) non-uniform distribution of formation pressure, c) heterogeneity of fluid saturation of the productive strata (gray oil and white water).
|
68,000 |
68000 |
|
Radial oil-saturated zone |
Радиальная нефтенасыщенная зона |
|
67,000 |
67000 |
|
Blocking oil flow by water flow from intake wells |
Блокирование потока нефти потоком воды из нагнетательных скважин |
|
66,000 |
66000 |
|
Relative SE dispersion, cond. Units |
Относительная дисперсия СЭ. усл. ед. |
|
65,000 |
65000 |
|
Anticipated flow rate, tons per day |
Прогноз дебита, т/сут. |
|
64,000 |
64000 |
|
|
|
|
63,000 |
63000 |
|
|
|
|
62,000 |
62000 |
|
|
|
|
43,000 |
43000 |
|
|
|
|
44,000 |
44000 |
|
|
|
|
45,000 |
45000 |
|
|
|
|
46,000 |
46000 |
|
|
|
|
47,000 |
47000 |
|
|
|
|
48,000 |
48000 |
|
|
|
|
49,000 |
49000 |
|
|
|
|
50,000 |
50000 |
|
|
|
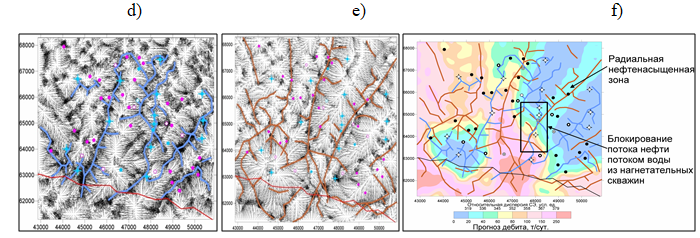
Fig. 2а. Results of MSE wave processing based on the results of SLEC monitoring at the Rostoshinskoye field in the Orenburg region: d) - layout of main channels of lateral water movement (blue) from intake wells, e) - the same for oil (brown) from the subvertical zone with intense fracturing (“geodynamic pump”), f) - comparison of layouts of the main channels of water and oil movement with a predictive estimate of oil flow rate (pink).
The layouts of the main channels of water (d) and oil (e) movement were determined based on vector gradients of the fields of average values and dispersion of the MSE process, respectively. By comparing these layouts (f), points of blocked oil flow were identified (which occurred due to the “geodynamic pump” effect in the south-western part of the site created by the water flow from the intake wells, which determined low flow rates in production wells located downstream of the intersection of these flows). This factor was subsequently taken into account when selecting the operation modes for intake wells. Based on the existing correlation between the dispersion values (for the MSE process) and the current well flow rate, a forecast was performed and potential flow rate maps were built for the productive deposit areas D3(f) and D4, which were further used for the selection of optimal drilling locations for new production wells.
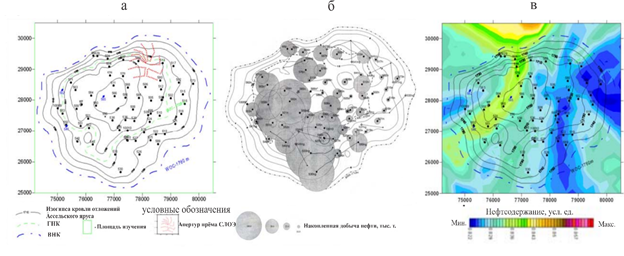
Example 2.Fig. 3 represents the results of SLEC monitoring used for the assessment of oil content in the productive carbonate mass at a later stage of development of an Asselian deposit located on the eastern dome of the Orenburg oil and gas condensate field (the Orenburg region) [11]. On the left (a), there is a structural map of the Asselian deposit cover with an area diagram of the SLEC receiving aperture (red) in the northern part of it, in the center (b), there is information on cumulative oil production for each production well, and on the right (c), there are main survey results obtained with the use of SLEC technology. The observation was conducted in the continuous monitoring mode for 30 days. A location survey was performed on an area of 35 sq. km. As of the moment of SLEC survey (2007), this deposit has been in development for more than 15 years, and the reserves were almost exhausted, since there were only 4 wells with oil inflow of more than 60 existing production wells.
A qualitative estimate of the oil content was obtained based on the autocorrelation value (at a τ fixed delay) of the MSE process at each monitoring point. Based on the results of processing and interpretation, it was established that the deposit saturation occurs from the north under the “geodynamic pump” effect (an abnormality on the northern border of the site) observed on the northern slope of the Orenburg barrier. The HC stream is traced along the fluid channel, which is represented by a linear zone with intense fracturing, from the “pump” up (in the radial direction) to the dome of the structure and further down in a different radial direction. At the same time, the above-mentioned 4 wells (with oil inflow) turned out to be in the fluid flow area, which confirmed the key results of the SLEC survey. Subject to the results of these surveys, various options for optimisation of the oil production were recommended based on the obtained fluid dynamic model of the geological environment containing the “geodynamic pump”, oil migration channels and traps where it is accumulated on different structural floors in the eastern dome of the Orenburg oil and gas condensate field.
|
30,000 |
30000 |
|
А |
а |
|
29,000 |
29000 |
|
B |
б |
|
28,000 |
28000 |
|
C |
в |
|
27,000 |
27000 |
|
Elevation contour of the cover of Asselian deposit |
Изогипса кровли отложений Ассельского яруса |
|
26,000 |
26000 |
|
BOBC |
ГПК |
|
25,000 |
25000 |
|
IOBC |
ВНК |
|
75,000 |
75000 |
|
- Area under survey |
- Площадь изучения |
|
75,000 |
75000 |
|
Legend |
условные обозначения |
|
76,000 |
76000 |
|
SLEC receiving aperture |
Апертур приёма СЛОЭ |
|
77,000 |
77000 |
|
Accumulated oil production, thous. Tons |
Накопленная добыча нефти, тыс. т. |
|
78,000 |
78000 |
|
Oil content, cond. Units |
Нефтесодержание, усл. ед. |
|
79,000 |
79000 |
|
Min. |
Мин. |
|
80,000 |
80000 |
|
Max. |
Макс. |
Fig. 3. Information on the deposit and results of
SLEC monitoring in the area of the eastern dome of the Orenburg oil and gas
condensate field (the Orenburg region): structural map of the cover of the Asselian
deposit with the position of SLEC receiving aperture, (b) cumulative oil
production for the period of the deposit development, and (c) the distribution
of oil content in the Asselian deposit according to the SLEC data.
Example 3. Fig. 4 shows some results of the SCSR technology application for studying the 3D distribution of open fracturing in productive Riphean deposits at the Kuyumbinskoye field (Eastern Siberia), which was under exploration for the period of performance of these works [6, 7]. More than 20 exploratory wells were drilled and tested; the maximum oil inflow of 120 tons per day was observed in well К-2; almost 40% of wells turned out to be non-productive. In Fig. 4-a, a seismic time section is shown with combined CDPM (black) and SCSR (color) data. Exploratory well К-219 was laid in the subvertical zone with anomalously high fracturing, and upon completion of drilling in this zone an oil inflow of about 400 tons per day was obtained from the Riphean deposits, which is anomalously high for this field. It should be noted that this well was drilled into the subvertical zone of intense fracturing after drilling the previous well К-217 into another similar zone, and after the completion of drilling, a maximum oil flow rate of about 800 tons per day was observed in it. Considering these positive results, SCSR survey was carried out in all exploration areas of this field (with a total area of ~6 thousand sq. km), where, according to SCSR data, abnormally high oil inflows were also obtained during well drilling. Given the existence of a high correlation dependence (Fig. 4-b) of the well flow rate on the fracturing (at the place of well location) in a number of areas, maps of open fracturing index were identified into the anticipated flow rate map (Fig. 4-c). This allowed to increase the exploratory drilling pace and reduce its cost by 4.6 billion rubles.
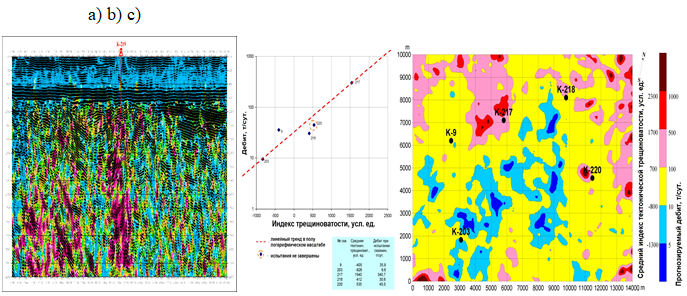
|
Well No. |
Average tectonic fracturing, cond. units |
Test flow rate, tons per day |
|
9 |
-405 |
35.9 |
|
203 |
-826 |
9.6 |
|
217 |
1,540 |
340.7 |
|
218 |
412 |
30.6 |
|
220 |
535 |
45.0 |
|
1,000 |
1000 |
|
10,000 |
10000 |
|
Average tectonic fracturing index, cond. units |
Средний индекс тектонической трещиноватости, усл. ед |
|
-1000 |
-1000 |
|
9,000 |
9000 |
|
2,300 |
2300 |
|
-500 |
-500 |
|
8,000 |
8000 |
|
1,700 |
1700 |
|
0 |
0 |
|
7,000 |
7000 |
|
700 |
700 |
|
500 |
500 |
|
6,000 |
6000 |
|
-800 |
-800 |
|
1,000 |
1000 |
|
5,000 |
5000 |
|
-1,300 |
-1300 |
|
1,500 |
1500 |
|
4,000 |
4000 |
|
Anticipated flow rate, tons per day |
Прогнозируемый дебит, т/сут. |
|
2,000 |
2000 |
|
3,000 |
3000 |
|
|
|
|
2,500 |
2500 |
|
2,000 |
2000 |
|
|
|
|
Flow rate, tons per day |
Дебит, т/сут. |
|
1,000 |
1000 |
|
|
|
|
Fracturing index, cond. units |
Индекс трещиноватости, усл. ед. |
|
11,000 |
11000 |
|
|
|
|
linear trend on a semi-logarithmic scale |
линейный тренд в полу логарифмическом масштабе |
|
12,000 |
12000 |
|
|
|
|
testing not completed |
испытания не завершены |
|
13,000 |
13000 |
|
|
|
|
|
|
|
14,000 |
14000 |
|
|
Fig. 4 Results of SCSR survey at the Kuyumbinskoye field (Eastern Siberia): a) a complex section based on CDPM and SCSR in well K-219 well drilled into a subvertical zone on this profile, where an abnormally high oil flow was observed b) a diagram of correlation between well flow rates (at the moment of testing) and the intensity of open fracturing, c) a map of the tectonic subvertical fracturing index and the anticipated oil flow.
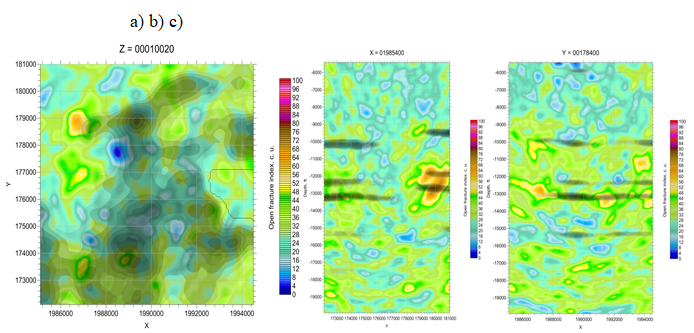
Example 4. The possibility of processing the source CDPM-3D seismic materials according to normal (SLEC) and lateral (SCSR) location survey algorithms to obtain cubes of open fracturing index and oil content in the geological environment has been implemented at a number of developed fields in Russia, the USA, Egypt, Vietnam, and other countries. As an example of the use of SCSR and SLEC software system for processing the source SDP-3D data, Fig. 5 shows fragments of a cube (area ~88 sq. km, depth interval from -5,200 to -20,000 ft, Texas, the USA) [1] with consolidated information on fracturing (black and white background) and oil content (color background): a horizontal section at the depth (10,020 ft) of occurrence of the Eagle Ford productive stratum (a) and vertical sections in the meridional (b) and latitudinal (c) directions. The fragments shown clearly demonstrate the possibility of using the obtained information for more complete development of oil deposits occurring in the studied volume of the geological environment. For example, it can be noted that the field has a block structure (elevated northern block) formed by a tectonic fault along the east-north-east strike, sealing (from the north) the central part of the field. The part of the filed located in the lowered southern block is placed on a slope, which hindered its detecting with the use of conventional methods of seismic survey. As is seen in the sections (Fig. 5-b and -c), this field contains three deposits of high oil saturation and two ones of low oil saturation. The cube analysis along horizontal slices and vertical sections allows for assessing the deposits configuration and the lateral non-uniformity of their oil content. This information, combined with data on the distribution of fracturing (within the target productive stratum), makes it possible to select the optimal location for opening these deposits in order to obtain an abnormally high oil inflow and essentially avoid drilling “dry” wells. In this case, there is an option of possible location of production wells when minimum water encroachment would be ensured at high production rates, which is quite realistic given the availability of complex information on fluid content (according to SLEC) and fracturing (according to SCSR), as well as on the structure (according to CDP or SDP) of the geological environment.
|
181,000 |
181000 |
|
-6,000 |
-6000 |
|
173,000 |
173000 |
|
180,000 |
180000 |
|
-7,000 |
-7000 |
|
174,000 |
174000 |
|
179,000 |
179000 |
|
-8,000 |
-8000 |
|
175,000 |
175000 |
|
178,000 |
178000 |
|
-9,000 |
-9000 |
|
176,000 |
176000 |
|
177,000 |
177000 |
|
-10000 |
-10000 |
|
177,000 |
177000 |
|
176,000 |
176000 |
|
-11,000 |
-11000 |
|
178,000 |
178000 |
|
175,000 |
175000 |
|
-12,000 |
-12000 |
|
179,000 |
179000 |
|
174,000 |
174000 |
|
-13,000: |
-13000: |
|
180,000 |
180000 |
|
173,000 |
173000 |
|
-14,000 |
-14000 |
|
181,000 |
181000 |
|
1,986,000 |
1986000 |
|
-15,000 |
-15000 |
|
1,986,000 |
1986000 |
|
1,988,000 |
1988000 |
|
-16,000 |
-16000 |
|
1,988,000 |
1988000 |
|
1,990,000 |
1990000 |
|
-17,000 |
-17000 |
|
1,990,000 |
1990000 |
|
1,992,000 |
1992000 |
|
-18,000 |
-18000 |
|
1,992,000 |
1992000 |
|
1,994,000 |
1994000 |
|
-19,000 |
-19000 |
|
1,994,000 |
1994000 |
The presented examples of the use of innovative SCSR and SLEC seismic technologies demonstrate their high potential for a significant increase in the efficiency (geological, economic, environmental, etc.) of exploration and development of oil and gas fields, which is especially important for brownfields. For this purpose, it is necessary to ensure not only the successful development of reserves in shale (oil-source) deposits, but also the detection and detailing of missed, left (“outliers” in the watered rock), extruded (beyond the contour), under-drilled (in depth) and other deposits, sections and intervals of high oil saturation in the geological environment of modern and previously developed fields with a well-developed surface infrastructure for efficient production, collection, preparation, and transportation of production wells products.
In these areas, in addition to effective additional exploration, oilfield seismometry methods should be applied, which, when used in the monitoring mode (SLEC-4D and SCSR-4D), provide for monitoring of spatial and temporal variations in fracturing and fluid content, that contributes to solving a wide range of problems in order to increase the oil recovery pace and rate while reducing the cost of its production and ensuring environmental safety.
List of references
Oleg L. Kouznetsov, Yury F. Lyasch, Igor A. Chirkin, Evgeniy G. Rizanov, Samuel D.LeRoy, and Sergey O. Koligaev. «Long-term monitoring of micro seismic emissions: Earth tides, fracture distribution, and fluid content.» Interpretation, May 2016, Vol. 4, No. 2 : pp. T191-T204
USGS-NEIC ComCat & Oklahoma Geological Survey; Preliminary as of Feb 17, 2016 [http://earthquake.usgs.gov/earthquakes/states/oklahoma/images/OklahomaEQsBarGraph.png
M.V. Gzovskiy Basics of tectonophysics. Moscow: Nauka, 1975, 536 p.
B.P. Dyakonov, I.S. Fayzullin. Response of fractured-block media to seismoacoustic effects and natural vibrations. Part 1. Fracture evolution under variable and natural loads. Geophysics, 3. 2009
Kuznetsov O.L., Dyblenko V.P., Chirkin I.A. et al Specifics of accumulation of stress energy and abnormal seismic acoustic emission in oil-bearing rocks. J. Geophysics, No. 6, 2007. P. 8-15.
O.L. Kuznetsov, I.A. Chirkin, Yu.A. Kuryanov et al. New technologies and solutions to applied problems. – M .: Center for Information Technologies in Management of Natural Resources, LLC, 2007. – 434 p.: (Seismoacoustics of porous and fractured geological environments: In 3 vol. Vol. 3).
O.L. Kuznetsov, I.A. Chirkin, Yu.A. Kuryanov et al. Experimental research. – М.: State Scientific Center of the Russian Federation – VNIIgeosystem, 2004. – 362 p. (Seismoacoustics of porous and fractured geological environments: In 3 vol. Vol. 2)
О. Kuznetsov, I. Chirkin, V. Firsov. Seismic monitoring as a tool for increasing the efficiency of oil field development. J. Energy Sector Technologies, No. 6 2006. p. 12-19
О.L. Kuznetsov, I.А. Chirkin, А.S. Zhukov, А.V. Volkov. Effect of luni-solar tides on changes in open fracturing of oil and gas reservoirs and its practical application. Geoinformatics, No. 10, М., 2006.
Decree of the Government of the Russian Federation No. 221 dated March 10, 2009, "Rossiyskaya Gazeta", federal issue No. 4872 dated March 20, 2009 Decree of the Government of the Russian Federation No. 221 dated March 10, 2009 "Rossiyskaya Gazeta", federal issue No. 4872 dated March 20, 2009
Authors:
Oleg Leonidovich Kuznetsov, Dubna State University, Doctor of Engineering, Professor, President of Russian Academy of Natural Sciences (RANS), Laureate of USSR State Prize and RF Government Prize,
Igor Alexeevich Chirkin, Dubna State University, Candidate of Engineering, Associate Member of RANS, Laureate of RF Government Prize,
Leonid Ivanovich Tverdokhlebov, Member of Central Commission for Reserves of Russian Federal Agency on Subsoil Use for Crude Hydrocarbons, Chairman of RANS Commission for Implementation of Innovative Technologies, Associate Member of RANS,
Aslambek Sipayevich Elzhayev, Head of Geophysics Department of Grozny State Oil Technical University, Сandidate of Geology and Mineralogy, H.T.,
Yevgeniy Gennadyevich Rizanov, Geoscientist, Geoseis Company LLC,
Sergey Olegovich Koligayev, Dubna State University,
Anton Alexandrovich Yurov, Chief Geoscientist, Geoseis Company LLC,
Mariya Vladimirovna Viushkina, Dubna State University, Graduate Student, Assistant at General and Applied Geophysics Department

