

Natural sources play a major role as energy providers. Natural energy sources include oil, natural gas, hard coal and lignite, oil shale and natural bitumen, as well as raw materials for nuclear power – uranium. All these are non-renewable sources of energy. Renewable sources of energy include sunlight, wind power, falling water, sea tides, and bio-resources.
Industries engaged in the production, logistics, and processing of various forms of fossil fuels, as well as, the processing, conversion, and distribution of various types of energy (thermal, electrical, etc.) are referred to as the energy sector. The energy sector includes fuel (oil, gas and coal), oil refining, petrochemical and energy (thermal, hydraulic and nuclear) industries.
The energy sector is the backbone of today's global economy. The level of development of the energy sector reflects on the countries' social and technological progress. It is hard to imagine our lives without fuel, energy, light, heat, communications, radio, television, transport, household appliances, etc. Without energy, the development of cybernetics, automation, computing and space technology would not be possible. Therefore, the consumption of energy and, energy resources respectively, grew consistently and particularly rapidly in the 20th century [1].
Nearly 90% of the world's natural resources of organic fossil fuels are solid – coal and lignite, anthracite, oil shale, bitumen, peat, and others. Their influence and significance – compared with liquid and gaseous fuels – prevailed up to the middle of the century and they still remain significant for the world economy. The majority of solid fossil fuels continues to be used as energy sources. The most widely used product of chemical processing of coal is coke, which remains the basis of ferrous and non-ferrous metallurgy. Whereas, a wide range of coke products are extracted from the liquid component – tar. These valuable products are dyes, varnishes, fertilizers, explosives, medicine, coal tar pitch and pitch binder, carbon electrode and graphite products, etc. [1].
Among energy sources, oil and gas play the primary role. Oil and gas are two unique and exclusive mineral resources. The petrochemical and gas products are used practically in all industrial sectors, in every type of transportation, in military and civil construction, agriculture, energy, household, and so on. A variety of chemical materials such as plastics, synthetic fibers, rubber, varnishes, dyes, detergents, mineral fertilizers and more are produced in large quantities from oil and gas. Oil and gas determine not only the economy and technological potential, but often a state policy as well [2].
However, it should be emphasized that the use of minerals for the purposes of energy has a negative impact on the environment:
- mechanical contamination of the air, water and land with solid particles (dust, ash);
- chemical, radioactive, ionic, thermal, electromagnetic, noise and other kinds of pollution;
- large water, earth, and oxygen consumption;
- global greenhouse effect, a gradual increase in the average temperature of the Earth's biosphere and the risk of an environmental disaster on the planet.
Figures 1 and 2 show the changes in the global energy balance over the time frame 1970-2040. [3].
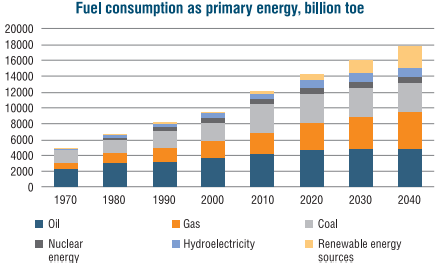
Figure 1 – Change in global consumption of primary energy by fuels
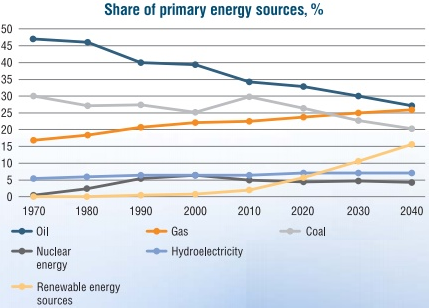
Figure 2 – Changes in the share of primary energy sources in global consumption
Studying the diagrams and the forecast by Shell up to 2050 [4], we can see that coal consumption in the global energy balance will gradually decrease, whereas the demand for natural gas will increase. Consumption of renewable sources of energy will increase as well. Oil consumption will be declining slightly, and by 2040 may fall to 27%, while its share in the global energy balance will remain the largest. It is important to highlight the increased demand for energy: in 1970 total energy consumption amounted to 4,876 mln. toe (tonne of oil equivalent), while in 2020 it reached 14,304 mln. toe, and this figure will continue to grow. Overall, most of the future energy demand will be met by minerals, just as it has in the past.
Tables 1-6 below show the latest statistics from British Petroleum on world oil and coal reserves, production volumes and the latest OPEC statistics on world reserves and gas production volumes.
|
Item no. |
Country |
Reserves, billion barrels |
Reserves, billion tons |
Global share, % |
|
1 |
Venezuela |
300.3 |
48.0 |
17.5 |
|
2 |
Saudi Arabia |
297.7 |
40.9 |
17.2 |
|
3 |
Canada |
167.8 |
27.1 |
9.7 |
|
4 |
Iran |
155.6 |
21.4 |
9.0 |
|
5 |
Iraq |
147.2 |
19.9 |
8.5 |
|
6 |
Russia |
106.2 |
14.6 |
6.1 |
|
7 |
Kuwait |
101.5 |
14.0 |
5.9 |
|
8 |
United Arab Emirates |
97.8 |
13.0 |
5.7 |
|
9 |
USA |
61.2 |
7.3 |
3.5 |
|
10 |
Libiya |
48.4 |
6.3 |
2.8 |
|
11 |
Nigeria |
37.5 |
5.1 |
2.2 |
|
12 |
Kazakhstan |
30.0 |
3.9 |
1.7 |
|
13 |
China |
25.9 |
3.5 |
1.5 |
|
14 |
Qatar |
25.2 |
2.6 |
1.5 |
|
15 |
Brazil |
13.4 |
2.0 |
0.8 |
|
16 |
Algeria |
12.2 |
1.5 |
0.7 |
|
17 |
Angola |
8.4 |
1.1 |
0.5 |
|
18 |
Mexico |
7.7 |
1.1 |
0.4 |
|
19 |
Azerbaijan |
7.0 |
1.0 |
0.4 |
|
20 |
Ecuador |
2.8 |
0.4 |
0.2 |
|
World reserves |
1,729.7 |
244.1 |
100 |
|
Table 1 – Confirmed oil reserves in the countries with the largest deposits [5].
|
Item no. |
Country |
Production, million tons per year |
Global share, % |
|
1 |
USA |
669.4 |
15.0 |
|
2 |
Saudi Arabia |
578.3 |
12.9 |
|
3 |
Russia |
563.3 |
12.6 |
|
4 |
Canada |
255.5 |
5.7 |
|
5 |
Iraq |
226.1 |
5.1 |
|
6 |
Iran |
220.4 |
4.9 |
|
7 |
China |
189.1 |
4.2 |
|
8 |
United Arab Emirates |
177.7 |
4.0 |
|
9 |
Kuwait |
146.8 |
3.3 |
|
10 |
Brazil |
140.3 |
3.1 |
|
11 |
Mexico |
102.3 |
2.3 |
|
12 |
Nigeria |
98.4 |
2.2 |
|
13 |
Kazakhstan |
91.2 |
2.0 |
|
14 |
Norway |
83.1 |
1.9 |
|
15 |
Qatar |
78.5 |
1.8 |
|
16 |
Venezuela |
77.3 |
1.7 |
|
17 |
Angola |
74.6 |
1.7 |
|
18 |
Algeria |
65.3 |
1.5 |
|
19 |
United Kingdom |
50.8 |
1.1 |
|
20 |
Oman |
47.8 |
1.1 |
|
World production |
4,474.3 |
100 |
|
|
No. |
Country |
Reserves, trillion m3 |
Global share, % |
|
1 |
Russia |
50.508 |
24.9 |
|
2 |
Iran |
33.899 |
16.7 |
|
3 |
Qatar |
23.846 |
11.7 |
|
4 |
USA |
13.554 |
6.7 |
|
5 |
Turkmenistan |
9.805 |
4.8 |
|
6 |
Saudi Arabia |
9.069 |
4.5 |
|
7 |
United Arab Emirates |
6.091 |
3.0 |
|
8 |
Nigeria |
5.675 |
2.8 |
|
9 |
Venezuela |
5.674 |
2.8 |
|
10 |
Algeria |
4.504 |
2.2 |
|
11 |
Iraq |
3.729 |
1.8 |
|
12 |
Australia |
3.175 |
1.6 |
|
13 |
China |
2.856 |
1.4 |
|
14 |
Indonesia |
2.841 |
1.4 |
|
15 |
Malaysia |
2.471 |
1.2 |
|
16 |
Egypt |
2.221 |
1.1 |
|
17 |
Norway |
2.210 |
1.1 |
|
18 |
Canada |
2.049 |
1.0 |
|
19 |
Kazakhstan |
1.885 |
0.9 |
|
20 |
Kuwait |
1.784 |
0.9 |
|
World reserves |
203.229 |
100 |
|
Table 3 – Confirmed gas reserves in the countries with the largest deposits [6].
|
No. |
Country |
Reserves, trillion m3 |
Global share, % |
|
1 |
Russia |
50.508 |
24.9 |
|
2 |
Iran |
33.899 |
16.7 |
|
3 |
Qatar |
23.846 |
11.7 |
|
4 |
USA |
13.554 |
6.7 |
|
5 |
Turkmenistan |
9.805 |
4.8 |
|
6 |
Saudi Arabia |
9.069 |
4.5 |
|
7 |
United Arab Emirates |
6.091 |
3.0 |
|
8 |
Nigeria |
5.675 |
2.8 |
|
9 |
Venezuela |
5.674 |
2.8 |
|
10 |
Algeria |
4.504 |
2.2 |
|
11 |
Iraq |
3.729 |
1.8 |
|
12 |
Australia |
3.175 |
1.6 |
|
13 |
China |
2.856 |
1.4 |
|
14 |
Indonesia |
2.841 |
1.4 |
|
15 |
Malaysia |
2.471 |
1.2 |
|
16 |
Egypt |
2.221 |
1.1 |
|
17 |
Norway |
2.210 |
1.1 |
|
18 |
Canada |
2.049 |
1.0 |
|
19 |
Kazakhstan |
1.885 |
0.9 |
|
20 |
Kuwait |
1.784 |
0.9 |
|
World reserves |
203.229 |
100 |
|
Table 4 – Level of gas production by the world's major gas producing countries in 2018 [6]
|
Item no. |
Countries |
Hard coal, million tons |
Lignite, million tons |
Total, million tons |
Global share, % |
|
1 |
USA |
220,167 |
30,052 |
250,219 |
23.7 |
|
2 |
Russia |
69,634 |
90,730 |
160,364 |
15.2 |
|
3 |
Australia |
70,927 |
76,508 |
147,435 |
14.0 |
|
4 |
China |
130,851 |
7,968 |
138,819 |
13.2 |
|
5 |
India |
96,468 |
4,895 |
101,363 |
9.6 |
|
6 |
Indonesia |
26,122 |
10,878 |
37,000 |
3.5 |
|
7 |
Germany |
3 |
36,100 |
36,103 |
3.4 |
|
8 |
Ukraine |
32,039 |
2,336 |
34,375 |
3.3 |
|
9 |
Poland |
20,542 |
5,937 |
26,479 |
2.5 |
|
10 |
Kazakhstan |
25605 |
- |
25605 |
2.4 |
|
11 |
Turkey |
551 |
10,975 |
11,526 |
1.1 |
|
12 |
Republic of South Africa |
9,893 |
- |
9,893 |
0.9 |
|
World reserves |
734,903 |
319,879 |
1,054,782 |
100 |
|
Table 5 – World coal reserves [5]
|
No. |
Countries |
Production, million toe |
Global share, % |
|
1 |
China |
1,828.8 |
46.7 |
|
2 |
USA |
364.5 |
9.3 |
|
3 |
Indonesia |
323.3 |
8.3 |
|
4 |
India |
308.0 |
7.9 |
|
5 |
Australia |
301.1 |
7.7 |
|
6 |
Russia |
220.2 |
5.6 |
|
7 |
Republic of South Africa |
143.2 |
3.7 |
|
8 |
Colombia |
57.9 |
1.5 |
|
9 |
Kazakhstan |
50.6 |
1.3 |
|
10 |
Poland |
47.5 |
1.2 |
|
11 |
Germany |
37.6 |
1.0 |
|
12 |
Mongolia |
34.4 |
0.9 |
|
World production |
3,916.8 |
100 |
|
Table 6 – World level of coal production in 2018 [5]
The largest oil reserves in the world belong to the OPEC countries, along with Canada and Russia.
The leaders in terms of oil reserves are the Middle East. The Middle East accounts for 48.3% of the world oil reserves. Some African countries, such as Libya, Nigeria, Algeria and Angola, have relatively large oil reserves. On the American continent, apart from Venezuela and Canada, the USA, Brazil, Mexico and Ecuador have significant reserves of oil. In the Asia-Pacific region, China holds the largest oil reserves, while Indonesia, India, Malaysia, Vietnam and Australia hold much smaller reserves (2.4 billion tonnes or 19.1 billion barrels). Countries in Europe possess the smallest reserves, the leader among which is Norway (1.1 billion tons or 8.6 billion barrels). Russia is ranked sixth in terms of recoverable oil reserves.
In the CIS countries, apart from Russia, Kazakhstan has 3.9 billion tons, or 30 billion barrels, and Azerbaijan holds 1 billion tons or 7 billion barrels.
Russia, Saudi Arabia and the USA are the world's major oil producing countries.
As for gas, Russia (50.508 trillion m3), Iran (32.899 trillion m3) and Qatar (23.846 trillion m3) are leading the way.
Saudi Arabia, UAE and Kuwait, apart from Iran and Qatar, have significant gas resources in the Middle East. On the American continent, the USA, Canada, and Venezuela own substantially large gas reserves. Among African countries, Algeria, Egypt, Nigeria and Libya (1.505 trillion m3) have relatively large gas reserves.
In the Asia-Pacific region, China, Indonesia, Australia, Malaysia and India possess gas resources. In the CIS, aside from Russia and Turkmenistan, there are natural gas deposits in Azerbaijan (1.269 trillion m3), Uzbekistan (1.542 trillion m3) and Kazakhstan (1.885 trillion m3).
Currently, the USA (863.415 million m3) and Russia (690.349 million m3) are leading in terms of natural gas production volumes globally with a significant difference from other natural gas producing nations. Large volumes of natural gas are produced in Iran, Canada, China, Australia, Qatar, Norway and Saudi Arabia.
The world's industrially extracted coal reserves are estimated at 1,054.782 billion tonnes, most of which are held by the USA, Russia, Australia, China and India. Large amounts of coal resources are also found in Germany, Ukraine, Kazakhstan, Poland and Indonesia.
China leads in coal production (46.7% of world production) by a wide margin. Among other countries that extract coal in large quantities are the USA, Indonesia, India and Australia. Coal is also mined in large quantities in Russia and South Africa.
In recent years, shale oil and gas fields have been actively developing in the USA. According to the U.S. Energy Information Administration, in 2018 the country produced 6.5 million barrels (or 886.6 thousand tons) of shale oil a day. In this article we define the term shale oil and shale gas as light oils and gases of low-permeability rocks. Tables 7 and 8 contain data on technically recoverable reserves of shale oil and shale gas, according to the information provided on the website of the U.S. Energy Information Administration [7].
|
Item no. |
Countries |
Reserves, billion barrels |
No. |
Countries |
Reserves, billion barrels |
|
1 |
USA |
78.2 |
7 |
Chad |
16.2 |
|
2 |
Russia |
75 |
8 |
Australia |
15.6 |
|
3 |
China |
32 |
9 |
Venezuela |
13.4 |
|
4 |
Argentina |
27 |
10 |
Mexico |
13.1 |
|
5 |
Libiya |
26 |
11 |
Kazakhstan |
10.6 |
|
6 |
United Arab Emirates |
22.6 |
12 |
Pakistan |
9.1 |
|
World reserves, billion barrels |
418.9 |
||||
Table 7 – Extractable shale oil reserves in the countries with the largest deposits
|
No. |
Countries |
Reserves, trillion m3 |
No. |
Countries |
Reserves, trillion m3 |
|
1 |
China |
31.58 |
7 |
Australia |
12.16 |
|
2 |
Argentina |
22.7 |
8 |
South Africa |
11.04 |
|
3 |
Algeria |
20.0 |
9 |
Russia |
8.06 |
|
4 |
USA |
17.63 |
10 |
Brazil |
6.93 |
|
5 |
Canada |
16.22 |
11 |
United Arab Emirates |
5.81 |
|
6 |
Mexico |
15.44 |
12 |
Venezuela |
4.74 |
|
World reserves |
214.55 |
||||
Table 8 – Extractable shale gas reserves in the countries with the largest deposits (Table 8)
As we can see in Tables 7 and 8, world shale oil and gas reserves are high. Russia and the USA have the largest shale oil resources. It is reported, that at least 80 billion barrels of shale oil have been discovered in Bahrain [8]. Argentina and Algeria hold large shale gas reserves, second only to China. Technically recoverable shale gas reserves are slightly larger than estimated natural gas reserves. The production method of shale oil and gas is more sophisticated than that of oil and gas: it is a combined technique of horizontal wells and hydraulic fracturing when high-pressure water is injected into wells with the addition of chemicals and sand. It is also important to note that in addition to extractable shale gas and oil reserves, there are many more shale oil and gas reserves that cannot be extracted using existing technology.
Throughout the years, abundant levels of oil production and oil export ensured growth of the country's economy. However, oil production is not capable of contributing to the effective development of an economy. More developed countries prefer oil refining because selling high-quality fuels generates more profit than selling crude oil. At the moment, Russia is behind Western countries on the depth of oil refining. Thus, the refining depth in the USA is about 97% and in Western Europe 95% respectively, while in Russia the actual refining depth is about 79% [9]. The low depth of refining is associated with the lack of advanced deep oil refining processes.
In addition to traditional and shale oils, there are large deposits of heavy oils and bitumen across the globe. The reserves of so-called unconventional oils are estimated to significantly exceed those of conventional oils and amount to about 70% of all hydrocarbon deposits [10]. Therefore, with gradual depletion of light and medium oil deposits, the focus will shift to unconventional oils.
According to some data there is 6.2 billion tons of high-viscosity oils in Russia [11], but it is likely that in fact the reserves are much larger. In addition, there are large deposits of bituminous sands (about 33 billion tons or 245 billion barrels), most of which are not yet accessible for extraction. Large reserves of still technologically unrecoverable natural bitumen are available in the diamond/gold bearing Lena-Anabar Basin Province (about 28.5 billion tons or 212 billion barrels) [12].
Another potentially viable hydrocarbon resource is bituminous shale. Oil from bituminous shale is obtained by means of thermally treating kerogen, the organic part of shale. Deposits of bituminous shale in the country are estimated at 39.4 billion tons or 248 billion barrels, and world deposits accessible for extraction estimated at 430 billion tons [12].
These oils are characterized by increased density, viscosity, coking capacity, increased content of resinous and asphaltene compounds, and hetero compounds, particularly sulphurous compounds. Such a complex occurrence of these oils, as well as their complex composition require new technologies for their production and transportation to be developed. Processing of such raw materials requires modernization of existing oil refineries and equipping them with modern facilities to efficiently treat heavy materials and obtain high quality fuels. Certain countries, such as Canada, have been effectively processing bituminous sands for the last 20 years [13], and the proportion of bituminous sands in Canadian production will amount to 75% by 2030 [14].
Thus, for at least the next several decades, oil and gas will remain the world's main energy source. Russia possesses abundant oil and gas reserves, as well as unconventional oils, such as heavy crude, bitumen and shale oils, which provide the country with a secure energy supply and a strong economy. In order to fully utilize the country's oil and gas potential, it is necessary to improve the oil refining process. Creation of new facilities, as well as modernization of existing refining facilities will make the oil industry resistant to the deteriorating quality of composition and hydrocarbon bearing raw materials. Implementation of modern oil refining processes will allow to produce high-quality motor fuels and lubricating oils, which will benefit the economy considerably more than the production and export of hydrocarbons.
References:
1. Akhmetov, S.A. The technology behind in-depth oil and gas processing. Teaching material for institutions of higher education / S.A. Akhmetov. – St. Petersburg: Nedra, 2013. – 544 p.
2. Akhmetov, S.A. Technology, economics and automation of oil and gas refining processes: Textbook / S.A. Akhmetov, M.H. Ishmiyarov, A.P. Verevkin, E.S. Dokuchaev, Yu.M. Malyshev; Editor C.A. Akhmetov. – Moscow: Chemistry, 2005. – 736 p.
3. BP Energy Outlook: 2019 edition [Electronic source]: – URL: https://www.bp.com/content/dam/bp/business-sites/en/global/corporate/pdfs/energy-economics/energy-ou... (Access date: 26.02.2020).
4. Shell energy scenarios to 2050. – 2008. – 52 p. [Electronic source]: – URL: https://www.shell.com/energy-and-innovation/the-energy-future/scenarios/new-lenses-on-the-future/ear... (Access date: 23.02.2020).
5. BP Statistical Review of World Energy 2019. 68th edition – 62 p. [Electronic source]: – URL: https://www.bp.com/content/dam/bp/business-sites/en/global/corporate/pdfs/energy-economics/statistic... (Access date: 22.02.2020).
6. OPEC Annual Statistical Bulletin 2019. 54th edition – 132 p. [Electronic source]: – URL: https://asb.opec.org (Access date: 22.02.2020).
7. Technically Recoverable Shale Oil and Shale Gas Resources. Independent Statistics & Analysis U.S. Energy Information Administration [Electronic source]: – URL: https://www.eia.gov/analysis/studies/worldshalegas/ (Access date: 22.02.2020).
8. Bahrain is betting on 80 billion barrels of oil to help clear its budget deficit, 8 may 2018 [Electronic source]: – URL: https://www.cnbc.com/2018/05/08/bahrain-discovery-of-80-billion-barrels-of-oil.html (Access date: 26.02.2020).
9. Ryabov, V.A. On the crisis issues in the oil-refining and petrochemical industry // V.A. Ryabov/ Siberian Oil and Gas, Issue 1 (34), 2019, p. 38-41.
10. Dong, X., Liu, H., Chen, Z., Wu, K., Lu, N., & Zhang, Q. Enhanced oil recovery techniques for heavy oil and oilsands reservoirs after steam injection // Applied Energy. – 2019. – 239. – pp. 1190-1211.
11. Bashkirtseva, N.Yu. High-viscosity oils and natural oils / N.Yu. Bashkirtseva // Kazan Technological University News, 2014, Issue 19, Vol.17, p. 296-299.
12. Kadiev, H.M. Hydroconversion of carbon-containing organic raw materials in the presence of nanosize catalysts based on molybdenum disulfide: thesis ... by Doctor of chemical sciences: 02.00.13 / Kadiev Khusain Magamedovich; [at A.V.Topchiev Institute of Petrochemical Synthesis, RAS (TIPS RAS) Russian Academy of Sciences, 2018 - 448 p.
13. Kurochkin, A.K. Synthetic crude oil. Thorough processing technologies of heavy Russian oils in refineries / A.K. Kurochkin, S.L. Toptygin // Oil and gas sector, 2010, Issue 1, p. 92-105.
14. Mamdouh, G. Salameh The Potential of Unconventional Oil Resources: Between Expediency & Reality // International Association for Energy Economics. IAEE Energy forum. Fourth quarter 2012. – Vol. 21. – pp. 17-20.
Authors:
Akhmetov
Safa Akhmetovich,
Doctor
of Engineering, Professor FSBEI
of Higher Education "Ufa State Petroleum Technological
University",
Mustafin
Ildar Akhatovich,
Candidate
of Engineering Sciences, Associate Professor FSBEI
of Higher Education "Ufa State Petroleum Technological
University",
Stankevich
Klara Yevgenyevna,
Candidate
of Engineering Sciences, Associate Professor FSBEI
of Higher Education "Ufa State Petroleum Technological
University",
Khanov
Aidar Rustamovich,
Doctoral
student FSBEI
of Higher Education "Ufa State Petroleum Technological
University",
Gantsev
Alexander Viktorovich,
Candidate
of Engineering Sciences, Associate Professor FSBEI
of Higher Education "Ufa State Petroleum Technological
University"

